Category Archives: Metrics

Time Cards

Time cards have been a symbol of manufacturing productive efficiency for years. I think we have all seen images of production and manufacturing associates dutifully standing in line to “punch in” at their appointed shift on the time clock. It seemed to be a marvelous mechanism to maintain, measure and direct those resources associated with production, in the most efficient manner. It is where the phrase “on the clock” originated. You came in and they started paying you when you “clocked in” and they stopped paying you when you “clocked out”. It was efficient.

By the way, the “Time Clock” that has become so universal when talking about clocking in and clocking out, first made its appearance on the business scene in the late nineteenth century.

” An early and influential time clock, sometimes described as the first, was invented on November 20, 1888, by Willard Le Grand Bundy, a jeweler in Auburn, New York. His patent of 1890 speaks of mechanical time recorders for workers in terms that suggest that earlier recorders already existed, but Bundy’s had various improvements; for example, each worker had his own key. A year later his brother, Harlow Bundy, organized the Bundy Manufacturing Company, and began mass-producing time clocks.” https://en.wikipedia.org/wiki/Time_clock

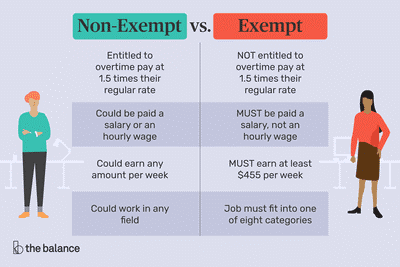
There then arose the dichotomy in business where there were those that were “paid by the hour” (those on the clock), or waged employees, and those that were paid a set amount per period of time, or salaried employees. Waged employees were referred to as Non-Exempt and Salaried employees were referred to as Exempt. These definitions were laid down in 1938 by the Fair Labor Standards Act.  https://www.investopedia.com/terms/e/exempt-employee.asp

Below is a brief comparison of the differences between the two:

So, why am I talking about one hundred and thirty year old inventions (Time Clocks) and eighty year old employee definitions (Fair Labor Standards Act)?

The reason is pretty simple. As the production and standardization processes that have been used in manufacturing have found their ways into the other disciplines and aspects of business, so has the cost tracking and charging of those resources responsible for doing the manufacturing.

We are now asking our exempt employees to fill out time cards associated with the work they are doing. This in and of itself is probably not a bad thing, however it engenders a new and different behavior in the exempt employee. It is this new “Time Card” behavior in exempt employees that can a detrimental effect on the business.

For lack of a better definition, exempt employees are paid by the “job” as opposed to by the “hour”. If an exempt employee must work late hours and weekends to complete their assignment, they do not get paid any more. They do however get the satisfaction of knowing the completed their task, regardless of how long it took them.

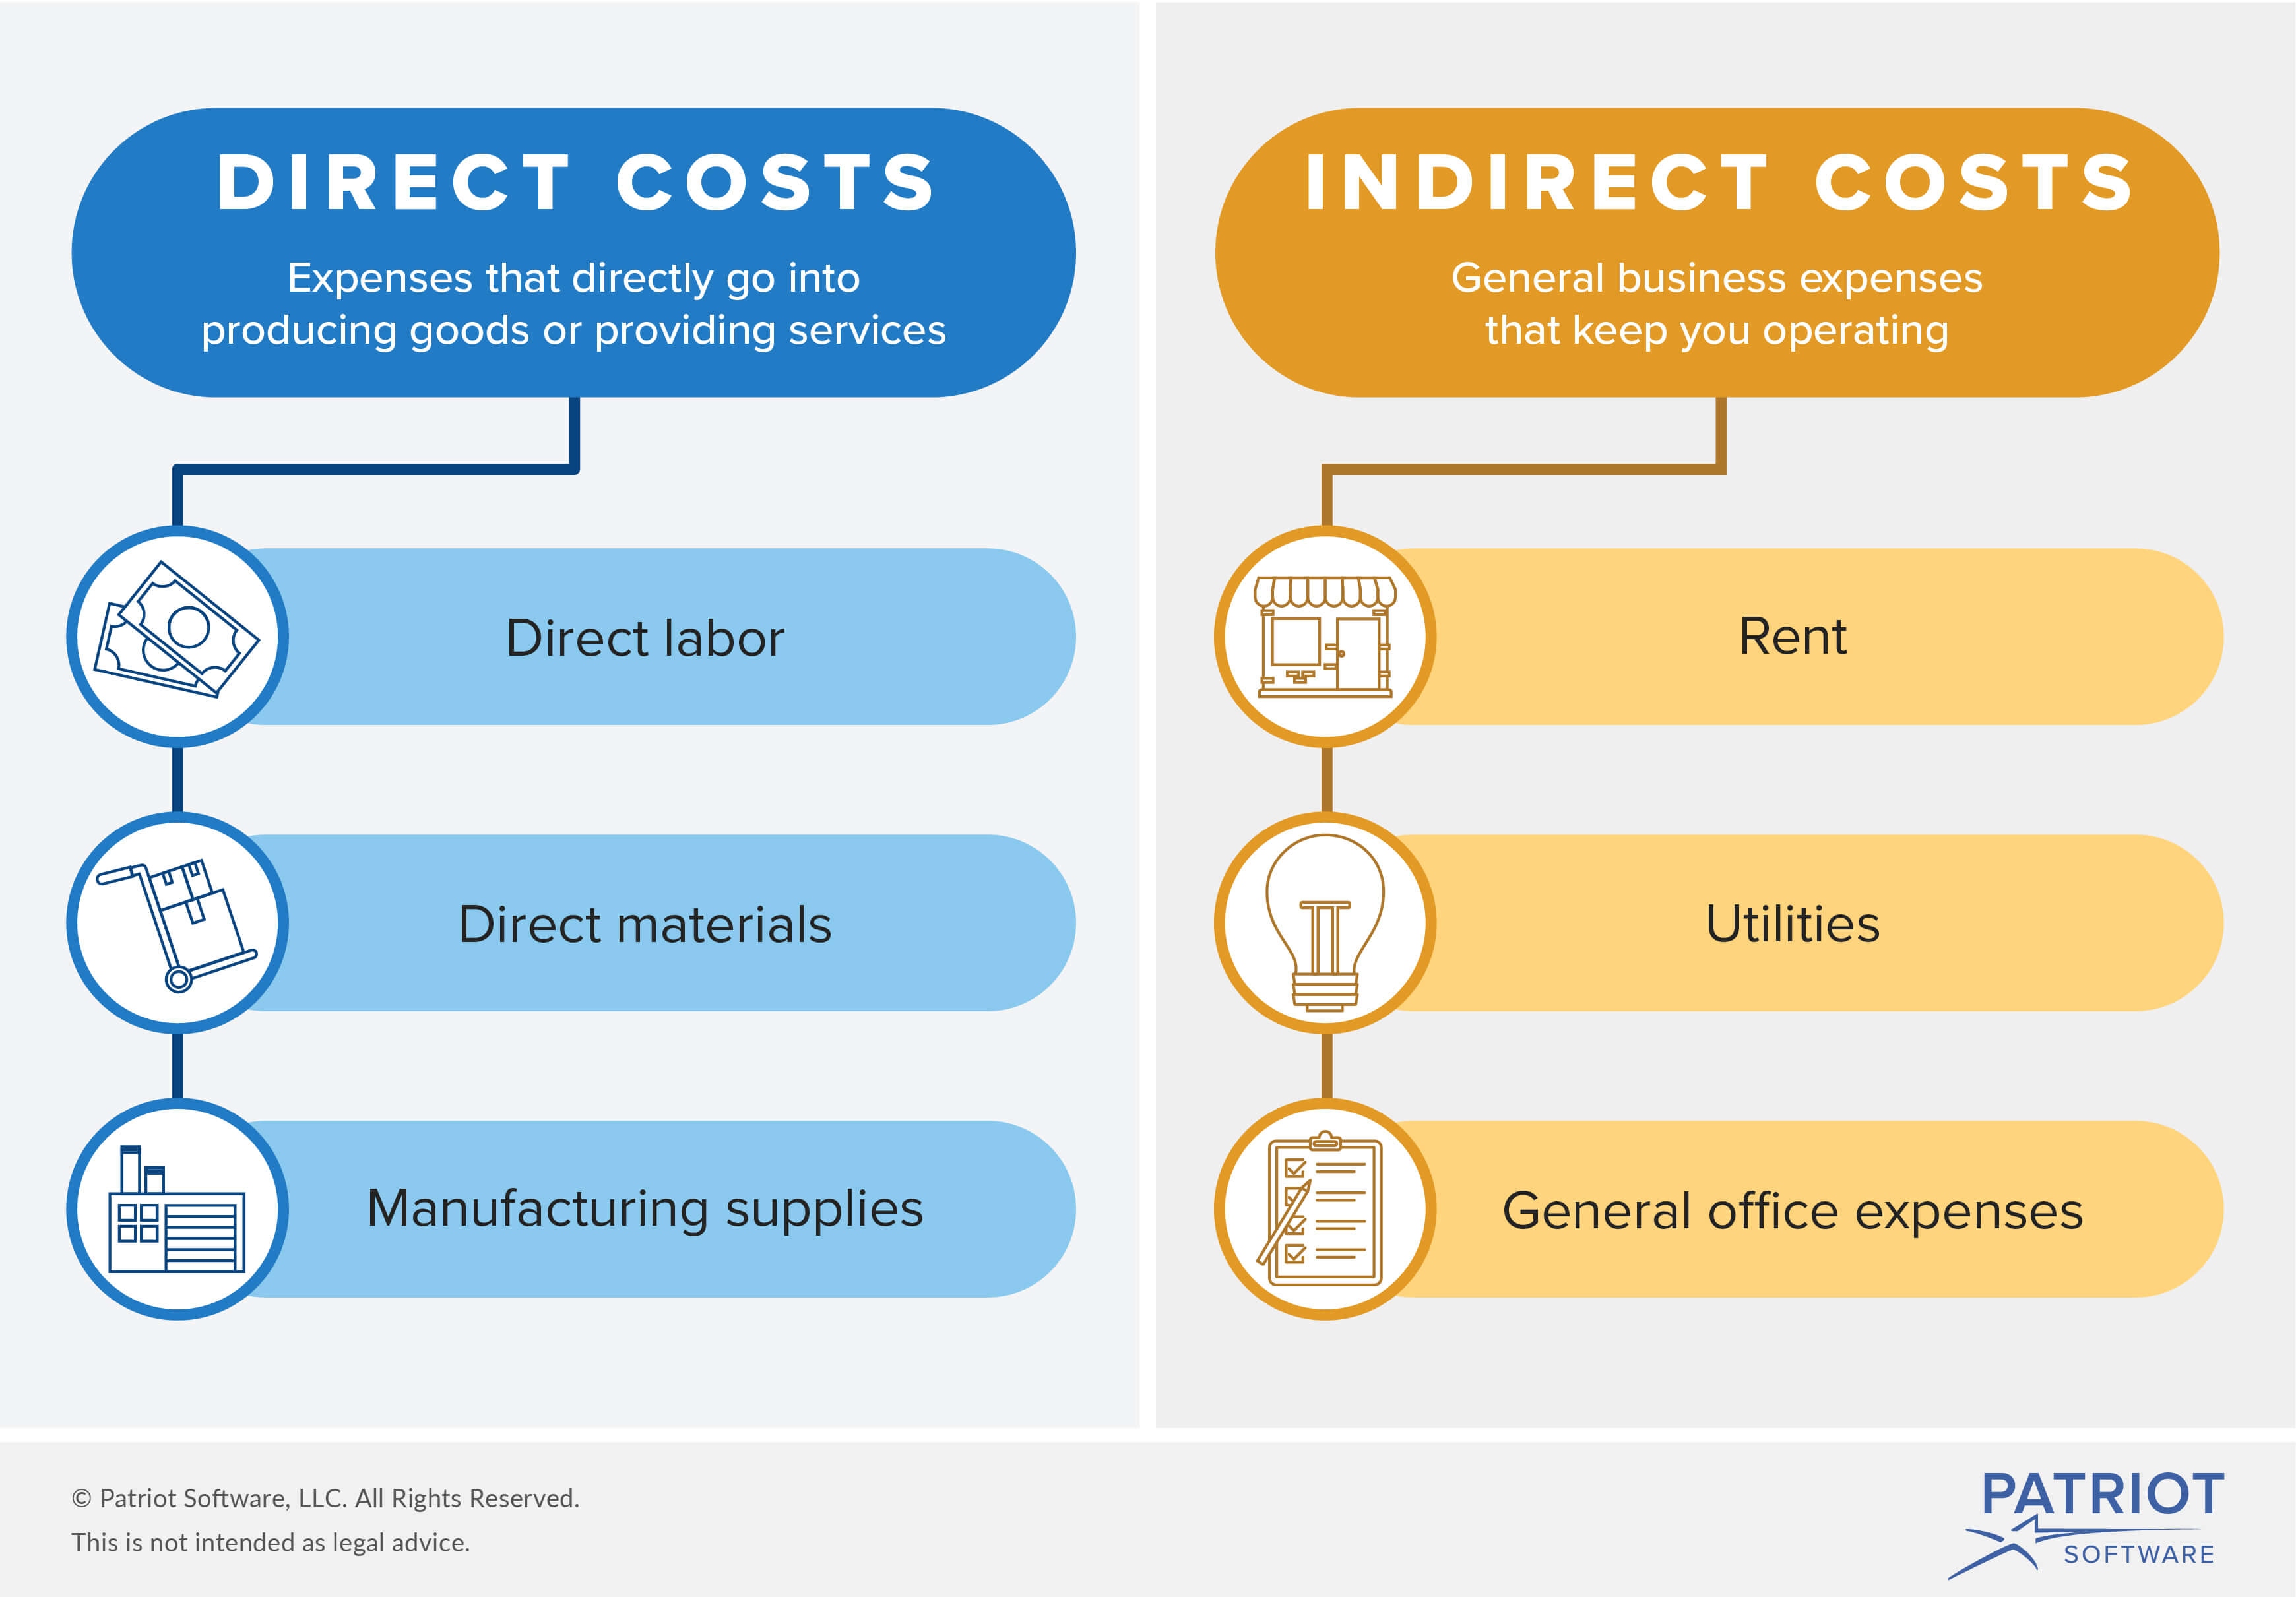
The idea of having exempt / salaried employees track their time, was to better associate costs directly with specific projects or activities. This association gave rise to the exempt employees who could directly associate their activities with specific items or revenue producing functions, and those that could not associate their work with specific items. Those that could be directly associated with specific products, projects and functions were called “Direct” labor, and those that could not be directly associated were called “Indirect” labor.

“The essential difference between direct costs and indirect costs is that only direct costs can be traced to specific cost objects. A cost object is something for which a cost is compiled, such as a product, service, customer, project, or activity. These costs are usually only classified as direct or indirect costs if they are for production activities, not for administrative activities (which are considered period costs).

The concept is critical when determining the cost of a specific product or activity, since direct costs are always used to compile the cost of something, while indirect costs may not be assigned to such a cost analysis. It can be too difficult to derive a cost-effective methodology for the assignment of indirect costs; the result is that many of these costs are considered part of corporate overhead or production overhead, which will exist even if a specific product is not created or an activity does not occur.” https://www.accountingtools.com/articles/the-difference-between-direct-costs-and-indirect-costs.html

The following as a good way to think about this. I promise I will get to my point about Time Cards and why this is important soon.

So, all of this work associated with slicing and dicing the time that salaried employees spend on their various activities is being done to understand what portion of their work can be directly associated with a cost object (Direct) and what portion cannot (Indirect). Why is this important anyway? It’s pretty simple.

All businesses want to reduce, minimize and otherwise exit overhead or indirect costs from the business equation.

Every business has the objective of reducing indirect costs, otherwise known as “Overhead”. As noted, these are the costs that cannot be directly associated with revenue production.

So, when Exempt, salaried employees are asked to fill out time cards, and they have multiple options, both “Direct” and “Indirect” to associate their time with, which are they going to choose? Knowing the corporate desire to minimize, reduce and exit Indirect and overhead costs from the business, they will naturally migrate their time charging to “Direct” functions and charges.

On the surface this might seem like a wonderful way for companies to reduce overhead, and in some instances, it will work. However, if you have the financial responsibility for one of these cost objects, you will want to be able to closely monitor the number of people and the amount they can charge to your cost object. This monitoring, or policing activity and capability again creates an incremental overhead.

It is essentially a transference of the overhead responsibility from the labor pool owner (of salaried, exempt employees), to the Cost Object owner.

Labor pool owners are always going to try and minimize the amount of their labor that is not directly associated with a revenue producing cost object. They will want to show the preponderance of their time, as reported by time cards, as being directly associated with a revenue producing function. Engineering groups, development groups, support groups and just about every other group will begin to display this behavior once time cards are utilized in this fashion.

The fear for them is that if they show too much time spent on overhead functions, they will be subject to a cost reduction activity in an effort to reduce overhead.

The results of this “Time Card” behavior are manifold:

  • With the pressure to be associated with, and charge to only Direct costs, the direct costs associated with specific cost objects can become inflated by excessive charging. Since direct costs are “above the line” in accounting and margin terms, this could result in inflated and non-competitive prices.
  • There will now be a somewhat adversarial relationship in place between those groups wanting to charge directly to cost objects, and those groups that are responsible for maintaining those cost object budgets, and the corporate inefficiencies and friction that this creates. There is also the non-productive time that will be spent challenging, changing and rectifying those charges as they come in.
  • There is non-productive time, effort and cost for increasingly capable corporate tools to maintain, monitor and control this type of charging effort. How do you control who should and should not charge to a cost object?

Time cards, like process can be a good thing. But like process, they should not be viewed as a replacement for judgement. When you move costs associated with time cards from indirect labor to direct labor, it may solve a corporate desire to reduce perceived overhead and indirect labor expenses, but it also creates several new issues and expenses associated with monitoring and controlling those charges. Due to how costs are accounted for in direct versus overhead items, it can also change both the cost profiles, margins and ultimately pricing profiles in the market.

Time cards in the salaried or exempt employee environment can and will change behaviors. Labor resource groups will increase their focus on having cost objects to charge to as opposed to understanding that there is to be expected a certain amount of slack time that they will have. Instead of the labor resource pool manager managing this slack level, time cards in essence transfer this issue to the cost object owners to try and control and manage.

Time cards for salaried and exempt employees can provide a better level of visibility into how time is spent and what employees are working on. It does however carry with it what is known as “The Observer Effect”.

I always try to sneak a little physics into any discussion.

“Observer effect (physics) In physics, the observer effect is the theory that simply observing a situation or phenomenon necessarily changes that phenomenon. This is often the result of instruments that, by necessity, alter the state of what they measure in some manner.”    https://en.wikipedia.org/wiki/Observer_effect_(physics)

As long as business is aware of how behaviors are changed, and what may need to be done to compensate for these changes, there can be value in them. However, without those considerations they can create an entire new set of issues for a business to deal with, and may result in little to no efficiency gains.

The Perfect Metrics

I think we as a species inherently love to measure things. I take that back. We love to measure everything. I am not a baseball fan, but I find it humorously entertaining the number of statistics that are available for seemingly any situation in baseball. I think it is possible to find the batting average for any player in late innings, with runners in scoring position, for away games with left hander pitchers on the mound. Really? I guess there must be someone interested in all that, but I can’t think of who it might be.

I am a hockey fan and there are a whole new generation of metrics created which I am not sure I entirely understand yet, but are supposed to give a much better measurement of the quality of the hockey players on the ice today. It seems that you can now get statistics for third line shots generated or allowed, for defensive players on offensive zone draws in the third period. Okay. I understand what all that means, but I am not sure if I care. Just drop the puck and skate.

I am not quite sure but it seems that some people are trying to make hockey appear to be more like baseball through the use of more and more arcane and detailed metrics. Unless they allow baseball players to carry their bats with them out into the field when they play, (stealing bases would get a whole lot more interesting) instead of just when that are at bat, or figure out a way to make hockey a whole lot slower and more boring, this would not seem to be a plausible goal.

The roundabout introduction here is that to generate all of these baseball statistics, someone had to measure and record all of these actions and variables. They had to create the metrics. And once they created these metrics it became a challenge to create the perfect metrics to more perfectly measure and reflect the game. After over one hundred years they are still trying. This should convince everyone from the onset that there are no perfect metrics. There are only good metrics, and other measurements.

I have had the opportunity in the past to be involved with many metrics projects, programs and functions during my time in business. It has been both an enlightening and useful process to me. It has helped me on several levels when it comes to the successful leadership of a business. In business as in sports, metrics are in part how we keep score.

Metrics are interesting in that they are indicators of performance. Hockey players with good performance metrics tend to be on good teams. Good teams tend to win more games. Winning is usually thought of as being a good thing. The new, complex metrics associated with Hockey seem to go a long way toward providing supporting evidence for how good and accurate the older simpler metrics associated with Hockey actually are. Interesting how that works.

It also seems to go that if a few metrics provide a reasonable indication of individual or business performance, then as we have noted in baseball, a very large number of metrics should provide a significantly more specific and detailed indication of individual or business performance. This thought process is along the lines of the old adage “If a little is good, a lot must be better.”

To extend the baseball analogy that is like saying if a beer or two is good while watching a game then two cases of beer should be excellent. You can find yourself at the game in a state of unconsciousness, immobility or alcoholism.

Similarly you can find yourself in business with so many metrics and indicators that they will begin to provide too much, or even conflicting indicators to the point that you end up in an immobile situation. Hence the phrase “Paralysis by Analysis”. I think I may prefer to refer to this situation as “metricoholism”, or the over dependence on and addiction to metrics to the point of being dysfunctional.

Metricoholism is the inability to have just one, or even a few meaningful metrics. It’s more along the lines of once you get started measuring things, you can’t stop. Eventually you will have measured everything, but will then have no idea what to do about all that you have measured.

I have found that the value of metrics lies in the talent of the people that are interpreting them. Metrics in and of themselves need to be the indicators of where additional human interaction with the business processes may be required in order to understand the possible underlying issues associated with the numeric measurement anomaly (metric). Good metrics identify the leverage points where analysis and performance modification can have the greatest effect on the business. Good metrics simply point to where the leader must look to understand what is affecting their business’ performance indicator.

There was a recent movie about the use of metrics in sports. It was called “Moneyball”. It was nominally a baseball movie, which meant for me that I would wait for it to be on television before I would watch it. I usually don’t pay money to watch a live baseball game because it is as I said a rather boring game to me. Why would I pay money to watch a movie about a rather boring game?

Just as an aside not all baseball based movies fall into this category. I thought “Field of Dreams” and “Bull Durham” were very entertaining movies, in spite of their baseball based premises. However “The Natural”, not so much.

In any event, Moneyball was the story of how a specific baseball team changed the way the business of the sport was conducted. By changing the way that the humongous amount of data associated with baseball and the baseball players was interpreted, they changed the way players and teams were viewed, built and paid for.

That bears repeating. By changing the way that the standard data (that was available to everyone) about the game and each of players was interpreted, one team changed the way an entire century old sports institution looked at how teams were built and how they should best perform.

The value was not in the data. Everyone had the same data. The value was in how the data was interpreted.

While interpretation of the data is going to be the key to success when it comes to metrics, it is also best to remember what Robert McNamara (one of the original automotive industry “whiz kids” of the 1960’s) said. He said:

“First thing: Get the data.”

The point is that there is a lot of data available. Which data do you go get. If you were a Metricoholic you would end up trying to get all of the data, since partial data would not be satisfactory. Also as previously noted, this would be a mistake. It takes far too much time, money and effort to do this and what are you going to do different with one hundred percent of the data that you wouldn’t do with eighty percent of the data.

That was an oblique reference to the old eighty – twenty rule where you can get eighty percent of the data in twenty percent of the time. If you can get eighty percent of the data reasonably quickly, you can make excellent business decisions from that data, and move on.

Good metrics for a business need to be relatively simple and straight forward. They need to deal with the basic functions and core values of the business, not the ancillary capabilities. Revenue, costs and profitability are good examples of simple metrics that all businesses use. I think there is probably a good reason for that. Performance levels and adherence to service levels are good metrics for service related industries. There are certainly others and they can be customized by business type and industry.

The key and the value to good metrics lie in their simplicity and their interpretation. Complex metrics just provide you complex data that is difficult to interpret. Exhaustive numbers of metrics generate exhaustive amounts of data that requires exhaustive interpretation. No amount of metrics, or process for that matter, can replace the need for talented people who can interpret the data, then decide where and what to act on.

The idea of good metrics should be to create a few indicators that measure the specific core leverage points of a business or organization. They should provide both a historical trend (are they getting better or worse) and a specific snap shot of performance. They should indicate where the interpreter of the information should go look for issues, if they are indicating issues. They should not be expected to indicate what the cause of the problem is, and certainly not what the solution to any particular issue will be.

Almost every business in existence already has some sort of metrics. Some are probably good metrics and some are probably just measuring something. There will also probably be those in the organization that are clamoring for more metrics as a way to improve performance.

However, I have found that good metrics are usually like bitter medicine. They are best and most effective when delivered in small doses, and usually best prescribed by someone outside the organization that does not have a stake hold to protect.

Just like healing oneself, measuring oneself is sometimes a difficult thing to accurately and honestly do as well.

Statistics and Performance

I always thought that Mark Twain was purported to be the author of one of my favorite quotes:

“There are three kinds of lies: lies, damned lies and statistics.”

I have come to find out that in his own autobiography Twain attributed this quote to a nineteenth century British statesman and former Prime Minister Benjamin Disraeli. This fact perplexed me slightly so I continued my research a little further using those modern bastions of all knowledge, Google and Wikipedia. After an exhaustive five minute search I found that the general consensus is that no one knows for certain who the author of one of my favorite quotes is. This fact will make it reasonably difficult to give attribution in the future should the opportunity to use it come up again.

Be that as it may, it may be time for me to take the slightest exception with one of my favorite quotes. When you are looking at the performance of a business, the numbers don’t lie. Now the way the numbers are arranged can sometimes be confusing or even misleading, so the business leader needs to be aware and careful.

I don’t say this too loud or too often, but I think I may understand numbers reasonably well. Physics, Mathematics, Finance, I have studied them all. And believe it or not, to one extent or another they are all numbers based disciplines. In addition to this degreed book learning, I have had what could almost be called a moderately useful stint of practical numerical application in the business world.

I sometimes use this unbridled numerical capability and familiarity to complete the most difficult of Sudoku number puzzles in the USA Today newspaper, or various in flight airline magazines. Just to stay in practice and make sure that I still “have it”.

Since it appears that this is going to be a quote based discussion, I might as well continue in that vein. Hippocrates, the ancient Greek physician (hence the source of the physicians “Hippocratic Oath”) said:

“There are in fact two things, science and opinion; the former begets knowledge, the latter ignorance.”

I think the corollary here is that if it cannot be expressed in numbers in business it is not fact, it is opinion. I have written and spoken in the past about the need for leaders in the business world to become increasingly more familiar with “numbers” of business as they matriculate up the leadership ladder. There may have been past instances of corporate wizardry where a leader intuitively knew what needed to be done (maybe Steve Jobs, or Bill Gates fall into this category), but their moves were invariably backed up by the analysis (numbers) justifying their moves. For the rest of us, as Robert McNamara said:

“Get the data.”

While I am muddling along focusing on equating science, facts and numbers, I probably should pay at least some heed to the power of opinion. While the truth may be out there, it will be people’s opinion of it that drives its valuation. As John Maynard Keynes, a man who is credited with some of the very foundations of economic theory (think of the source of Keynesian Theory) said:

“A study of the history of opinion is a necessary preliminary to the emancipation of the mind.”

Okay, enough quotation roulette. I hope you get my point, whatever it was.

Now back to the topic; in the business world, the proper statistics, when properly presented and interpreted are invariably a good indicator of business performance. That is correct. Statistics, which are the indicators associated with past performance, are usually good indicators of future performance. I understand that Mark Twain, Benjamin Disraeli and whoever actually created one of my favorite quotes regarding statistics are all probably collectively grumbling, wherever they are, but this is the case.

This brings us to probably the most common and clichéd quote in this dialog:

“Past Performance is Not Necessarily Indicative of Future Results”

We have all probably seen it or read it on just about any investment prospectus ever written. Why is it there? To make sure that we all know that just because an investment that has done well in the past does not mean that it will continue to perform, or do as well in the future. Investment firms don’t want anyone to cry “foul” if they have not interpreted the statistics properly or if a statistical performance anomaly occurs in the market. So with this in mind I now ask the following question:

When we have the choice of making an investment, or are reviewing the continuation of an existing investment, which investment alternatives do we choose: those that have done well in the past, or those that have done poorly in the past?

All things being equal, and pursuing an intelligent risk diversification portfolio, understanding long term investment return and interest rates, blah, blah, blah…..we almost always pick the one that has done well in the past expecting (hoping) that all things being equal it will continue to exhibit the same performance traits going forward. We very rarely select the one that has been performing relatively poorly expecting (hoping) that it is going to turn around. Why do you suppose that is?

Welcome to the world of statistics. You have taken the data points associated with performance in the past, extrapolated the line or curve forward and made a choice and prediction about the future. Statistically speaking that is probably the correct choice. But this isn’t a discussion about investments. It is a discussion about business. And the same exact concepts apply.

Herein lies a rub. Statistics can only be misleading if you don’t understand the underlying numbers. Hence my predilection and continued haranguing regarding the necessity of leaders being numerically literate. Remember there is another quote that may also be incorrectly attributed to Mark Twain:

“Figures don’t lie, but liars do figure.”

The author of this quote also appears to be shrouded in the past as well, but like all the other good quotes of the period, it was attributed to Twain.

Let’s look at a simple statistical example to make my point. Let’s say that in the next measurement period (it doesn’t matter how long the period is) that a business sells one more product unit than it did the previous measurement period. This is good right?

Basically the answer is “yes” selling more, any more is usually always good, but how good? If it is your first measurement period in business, it’s hard to say how good without more data (statistics). If you only sold one unit the last period, and then you sell two units this period, that is sales growth, but it is still difficult to evaluate without more data. If you sold a thousand units last period, then one more this period might not be statistically important.

On the other hand all of those responses could be changed depending on the cost and value of the product being sold. If you are selling nuclear power plants as opposed to canned hams, a single unit growth in sales could be seen as spectacular, whereas the sale of a single additional canned ham might not be a cause for much celebration.

Statistically speaking selling one more than nothing is infinite sales growth but it is still only one unit. Selling one more than one is one hundred percent growth, but it is still only two units. Selling one more than one thousand is only one tenth of a percent growth. All represent the same one unit growth, but can be represented significantly differently in the statistical growth example. The wary leader needs to always be aware of how statistics are being used and the story that is trying to be portrayed.

Again, when using data and statistics unless a business can specifically quantify what changes it is going to make and how those changes are going to be translated into performance, like your investment decisions discussed earlier, you would expect the business to perform very much in the future as it is doing today. It is through this process that the market valuates companies, and it is through this process that companies provide their future forecasts of performance.

Leaders always need to be aware that statistics are extensions of the data. They are the way that the data is being presented and interpreted. The data is the fact. It is the consistency of the statistic, the interpretation of the data that is the key. Understanding the underlying numbers, and the analysis and statistics associated with them is required and essential for the successful leadership of the business. To not be able to do so is to be at the mercy of those that do.

Because as Mark Twain also (and finally) said (and this one is actually directly attributed to him):

“Facts are stubborn things, but statistics are pliable.”

The Color of Information


What did we do before we had color printers? I can remember when color printers first started to make their appearances in the office. They were big. They were expensive. They were only supposed to be used for specific documents. They were aggressively guarded by the administrative assistants that had responsibility for them and they couldn’t be used without special permission. That is obviously no longer the case. Color printer sizes and prices have come down to the point where the old black and white only printers are now a thing of the past. Color is so ubiquitous on both our screens and our printing that we appear to have become fully dependent on color to convey our information. While I do utilize color in my documents and presentations, I can’t help but feel that many managers may have now become so dependent on the color code of information that they may no longer feel the requirement to understand the actual underlying values of the information.


It seems that what was once provided to management as data is now provided as colors. Instead of quantifying a performance issue, we are now providing a “traffic light” condition sound bite. It is now condition “red” for issues and adverse situations, condition “yellow” for potential problems, and situations where there are no imminent threats – condition “green”. I understand the need to distill down information to make it more manageable, but I don’t think you can properly run a business based on the colors of a traffic light. I am concerned that we are now into the same thirteen second sound bite mentality for managing our businesses as we are in when we watch the 5:00 news on television.


This “just give me the high points” three-color approach to management has a tendency to indicate to the team that the desire of management is not to get too deeply engaged in the issues of the business. It appears that management is becoming interested only in the performance of the business, not in how the business is running. If the team feels that management doesn’t want to be too deeply engaged in the business, it will not be long before that sentiment is reflected throughout the team as well.


Some of my first experiences in management were working for an executive who was extremely knowledgeable about the businesses that he had responsibility for. As such, he demanded that his management team know at least as much, if not more about the business than he did, if they were to be value add to both the business and management chain. As such these businesses were relatively well run and profitable. An in depth understanding of the issues, data, finances and how the business worked was required in order to maintain the high level of performance of the business.


With a “three-color” approach to management, leaders are communicating that they in fact do not want to know as much about the business as the management team and all that they are really interested in is “stop”, “go” and “caution” status of the business. Where in the past it was required that the management team have a greater in depth knowledge of the business than the knowledgeable leadership team to provide value add to the business, the three-color management approach now calls into question the value add of an unknowledgeable leadership to the business.


It is a long leap from the proliferation of color printers and presentations to indicting business leadership for seemingly removing themselves from the detail associated with the running a business and its management process. I have stated in the past that metrics, be it tabulated data or color codes, only point you in the direction of the issues and more importantly point you in the direction of the potential solutions. Three-color metrics would seem to only point you at the issue without the value add of any direction toward a potential solution. As an example, with all the other inputs that are required to drive a car, a successful trip anywhere would be doubtful if traffic lights were your only source of information.

I guess I am still of the old school that good business leadership requires a leader that is well versed and knowledgeable about the business they are leading. A good leader needs to understand not only the performance of the business, but how the business works. To extend the traffic light – automobile analogy a little further, a leader may not need to know how the car works in order to drive it, but a leader will definitely need to know how it works if they are ever going to be called on to fix it.

Business Oxymorons


Every time I get a memo, directive or request from management, or anyone else for that matter, that causes me to shake my head, I put it in a file where I can review it and smile at a later date. I have to do that because sometimes it is almost impossible to believe in, let alone laugh at many of the documents and directives when they are actually issued. It seems that it is only on reasonable reflection that the humor associated with the document can be appreciated. Over the years I have amassed a fairly large file of what I like to refer to as management “Business Oxymorons”. Here are some of my favorites.


Process Simplification:


Process simplification has long been a target for cost cutting and efficiency increasing projects and teams. Regardless of how the business is structured, or what processes there may be in place, this is an area that can and will receive incremental focus. My favorite approach here was when I received a 36 chart presentation deck detailing the process we would all be using going forward for corporate process simplification. That is correct. It took 36 charts to detail out how we were going to simplify things. Needless to say, I had a suggestion for the first process to focus on for future simplification.


Announcing / Assigning a New Team to Track Cost Reduction:


Like process simplification, cost reduction is also always a favorite topic for management attention. Indeed cost reduction should be an ongoing focus for every business. The point here is the activity of cost reduction should be the focus. The idea is to reduce costs. The tracking of cost reduction doesn’t actually reduce any costs. It could be argued that one of the best ways to start reducing costs would be to get rid of all the teams whose only responsibility is to track cost reductions, since they are actually an unproductive incremental cost to the business. I always thought that the people who were implementing cost reductions were also capable of tracking cost reductions too.


Unprofitable “Strategic” Business:


I wrote an entire post dedicated to this concept a few weeks ago. Sales teams want to sell things. That is what they are supposed to do. Customers usually want the lowest price possible for the goods and services that they are going to purchase. Sales teams try to get their customers the lowest price possible, sometimes by describing the business opportunity as “Strategic”. Getting requests to discount product and service prices to the point of unprofitability because it is strategic to the company to get this business has always been an interesting exercise in logic for me. How can bringing in any incremental unprofitable business be of benefit to a company, let alone strategic to it?


Multi-Tasking Equals Productivity:


We are all continually asked to do more. That is the nature of business. How we go about it is the key to our effectiveness. I know many people who pride themselves on their ability to be on conference calls, do their email and converse on their computer’s instant messaging system at the same time. I also notice that these people are usually so busy that they never get anything actually accomplished or completed. Productivity is the measure of things that are completed, not the measurement of the number of things being done concurrently. It is similar to the idea about the difference between work and progress. Work can be a great deal of splashing around in a pool. Progress is actually swimming somewhere.


Measurement is the Solution:


It seems that whenever there issues in a business, the first thing management requests are a brand new set of metrics and reports regarding the already identified issues. Metrics and measurements are key tools and sources of data for any manager and business. They help us keep score. They help identify where issues may lie and where performance may need to be improved. Measurements very seldom tell us how to improve performance, only that against some sort of scale that performance needs to be improved. More measurements or more detailed measurements may not help this situation. It is the decisions that are made and the actions that are taken in the business as a result of the measurement information that are the solution. Business measurements are a ways to a means, not a means unto themselves. The 80 / 20 rule truly does apply to measurements and data, and the idea of trying to measure your way out of a performance issue rarely works.


Global Projects:


The world is a very big place and the way business is conducted varies significantly from place to place in it. Global tools, programs and platforms, while always a desirable goal are almost always problematic when it comes to implementation, but that has never seemed to stop the drive towards them. Part of this issue seems to be in that global projects focus on trying to remove the differences between business regions instead of leveraging the similarities that the regions have. By the time you modify the tool, platform or project to take into account every regional business difference, you usually have a uniform solution that is so large, complex, expensive and unmanageable that it is worse than the separate and discrete capabilities it replaced. My father would have called this phenomenon the starting of a vast project with something along the lines of a half vast idea.


These are just a few of the business oxymorons that I have in my file. I am sure there are others that I will bring out in the future. I believe it is the irony associated with the approach as it applies to what was obviously the desired solution that causes me to share them here. It appears that at least in some circumstances it is true what has been said about good intentions. It also doesn’t hurt to find the humor in it.

Metrics


We are a numbers driven world. Look at the way we all watch the weather reports for tomorrow’s temperature. We watch the stock market to see where the market is today and what the change is from yesterday. We are constantly being told of unemployment rates, interest rates, price changes and approval ratings. Look also at the way we watch our own key performance indicators to help us keep track of the health of our businesses. Metrics are an important aspect of what we do. They shape our opinion of our world and of how things are going.


We need to remember that good metrics do not cause good performance. Good metrics measure performance, good or bad. Metrics provide you guidance on how to look at the various aspects of the business.


Metrics also take time and effort. They require business leaders to continually make judgments as to whether the effort required to generate different or more detailed tools and systems will result in better visibility and detail of the performance of the various aspects of the business, and if this better visibility can provide better guidance as to what potential changes need to be made to the organization. The other side of this business discussion is could the effort required to generate better the better tools and systems be invested in the elsewhere in the business and provide a better return (more sales, cost reductions, etc.).


More detailed or complex metrics will not improve your business’ performance. Good planning, implementation, competitive capabilities and commitment to cost control will help improve your business’ performance. It is not the metric that improves your business. It is what you do with the metric that can improve your business.


Metrics are a ways to a means. In many instances they seem to have become the means unto themselves. The objective is not to have good metrics. The objective is to have a good business, where the metrics will reflect this performance. Businesses in some instances have a tendency to believe that it is the metrics fault that poor business performance is being reflected. This phenomenon can be seen in the periodic revamping of report and review materials to provide more and greater detail. Real information has a tendency to be subjected to ever more complex statistical analysis in order to provide more detailed views of performance.


I have found that metrics, like objectives are best when they are very simple, and focused. They need to focus only on those attributes that directly affect your ability to achieve your goals. If they require incremental or additional explanation, then they are not appropriate to the business. They should almost be intuitive in the nature of the information that they are conveying. Good metrics should guide you both on performance and what type of changes, if any need to be made to the business.


Metrics should provide facts and real event based information, not statistical means or averages. Remember what Mark Twain said about statistics.


“There are lies, damn lies, and then there are statistics.”


Keep the metrics simple, focused and fact / event based. It’s not the metric; it’s what is done with the information the metric provides that is important.

Watch the Operational Metrics

Mark Twain said “There are lies, damned lies,…and then there are statistics.” In some instances he could have just as easily been talking about metrics.


We all understand the need for metrics when it comes to running a business. If you can’t keep score, how do you know if you are winning or losing? Just remember when you start basing compensation on these metrics that it is changing the game that is being played.


Here is a good case in point. A business I knew was running in the red. A look at the product prices (and costs) showed that it was almost 20% more expensive than the competition on a cost basis. However, based on the operational metrics they were running at the peak of efficiency (99+% on the production yield targets). How could this be?


A deeper dive into the metrics showed that over time the production yield targets had been lowered (to an 86% yield target!) so that the operational team could maximize their goal attainment and incentive compensation. They were actually achieving 99+% of an 86% target.  The rest of the market was attaining true 99+% production yields. The incremental 14% disadvantage in production efficiency was the root cause of the product cost differential in the market.


Over time it had become easier for the operation to change the metric that it was measured (and paid) on, than it was to improve the process. This is obviously an extreme case, and it was a metric “creep” that had occurred over many years. But it does point out how a metric can affect how you look at a business’s performance. You can go from looking seriously at exiting a business because it is thought that it could not effectively compete, to looking at the root cause of the issue: how do you make the business more efficient and continue to compete.